aPriori Admin Platform Design
Client:
aPriori Technologies Inc.
Team:
PM .(3), Dev. (5)
Role:
Product Designer, Researcher
Timeline:
12 weeks
Users:
2000
Introduction:
While it might seem that customers prefer to receive support from live representatives, data suggests otherwise. aPriori Technologies received multiple customers' requests for a self-service application to manage users in the cloud. Customers wanted to have the ability to solve their issues without reaching out to the support team.
Problem
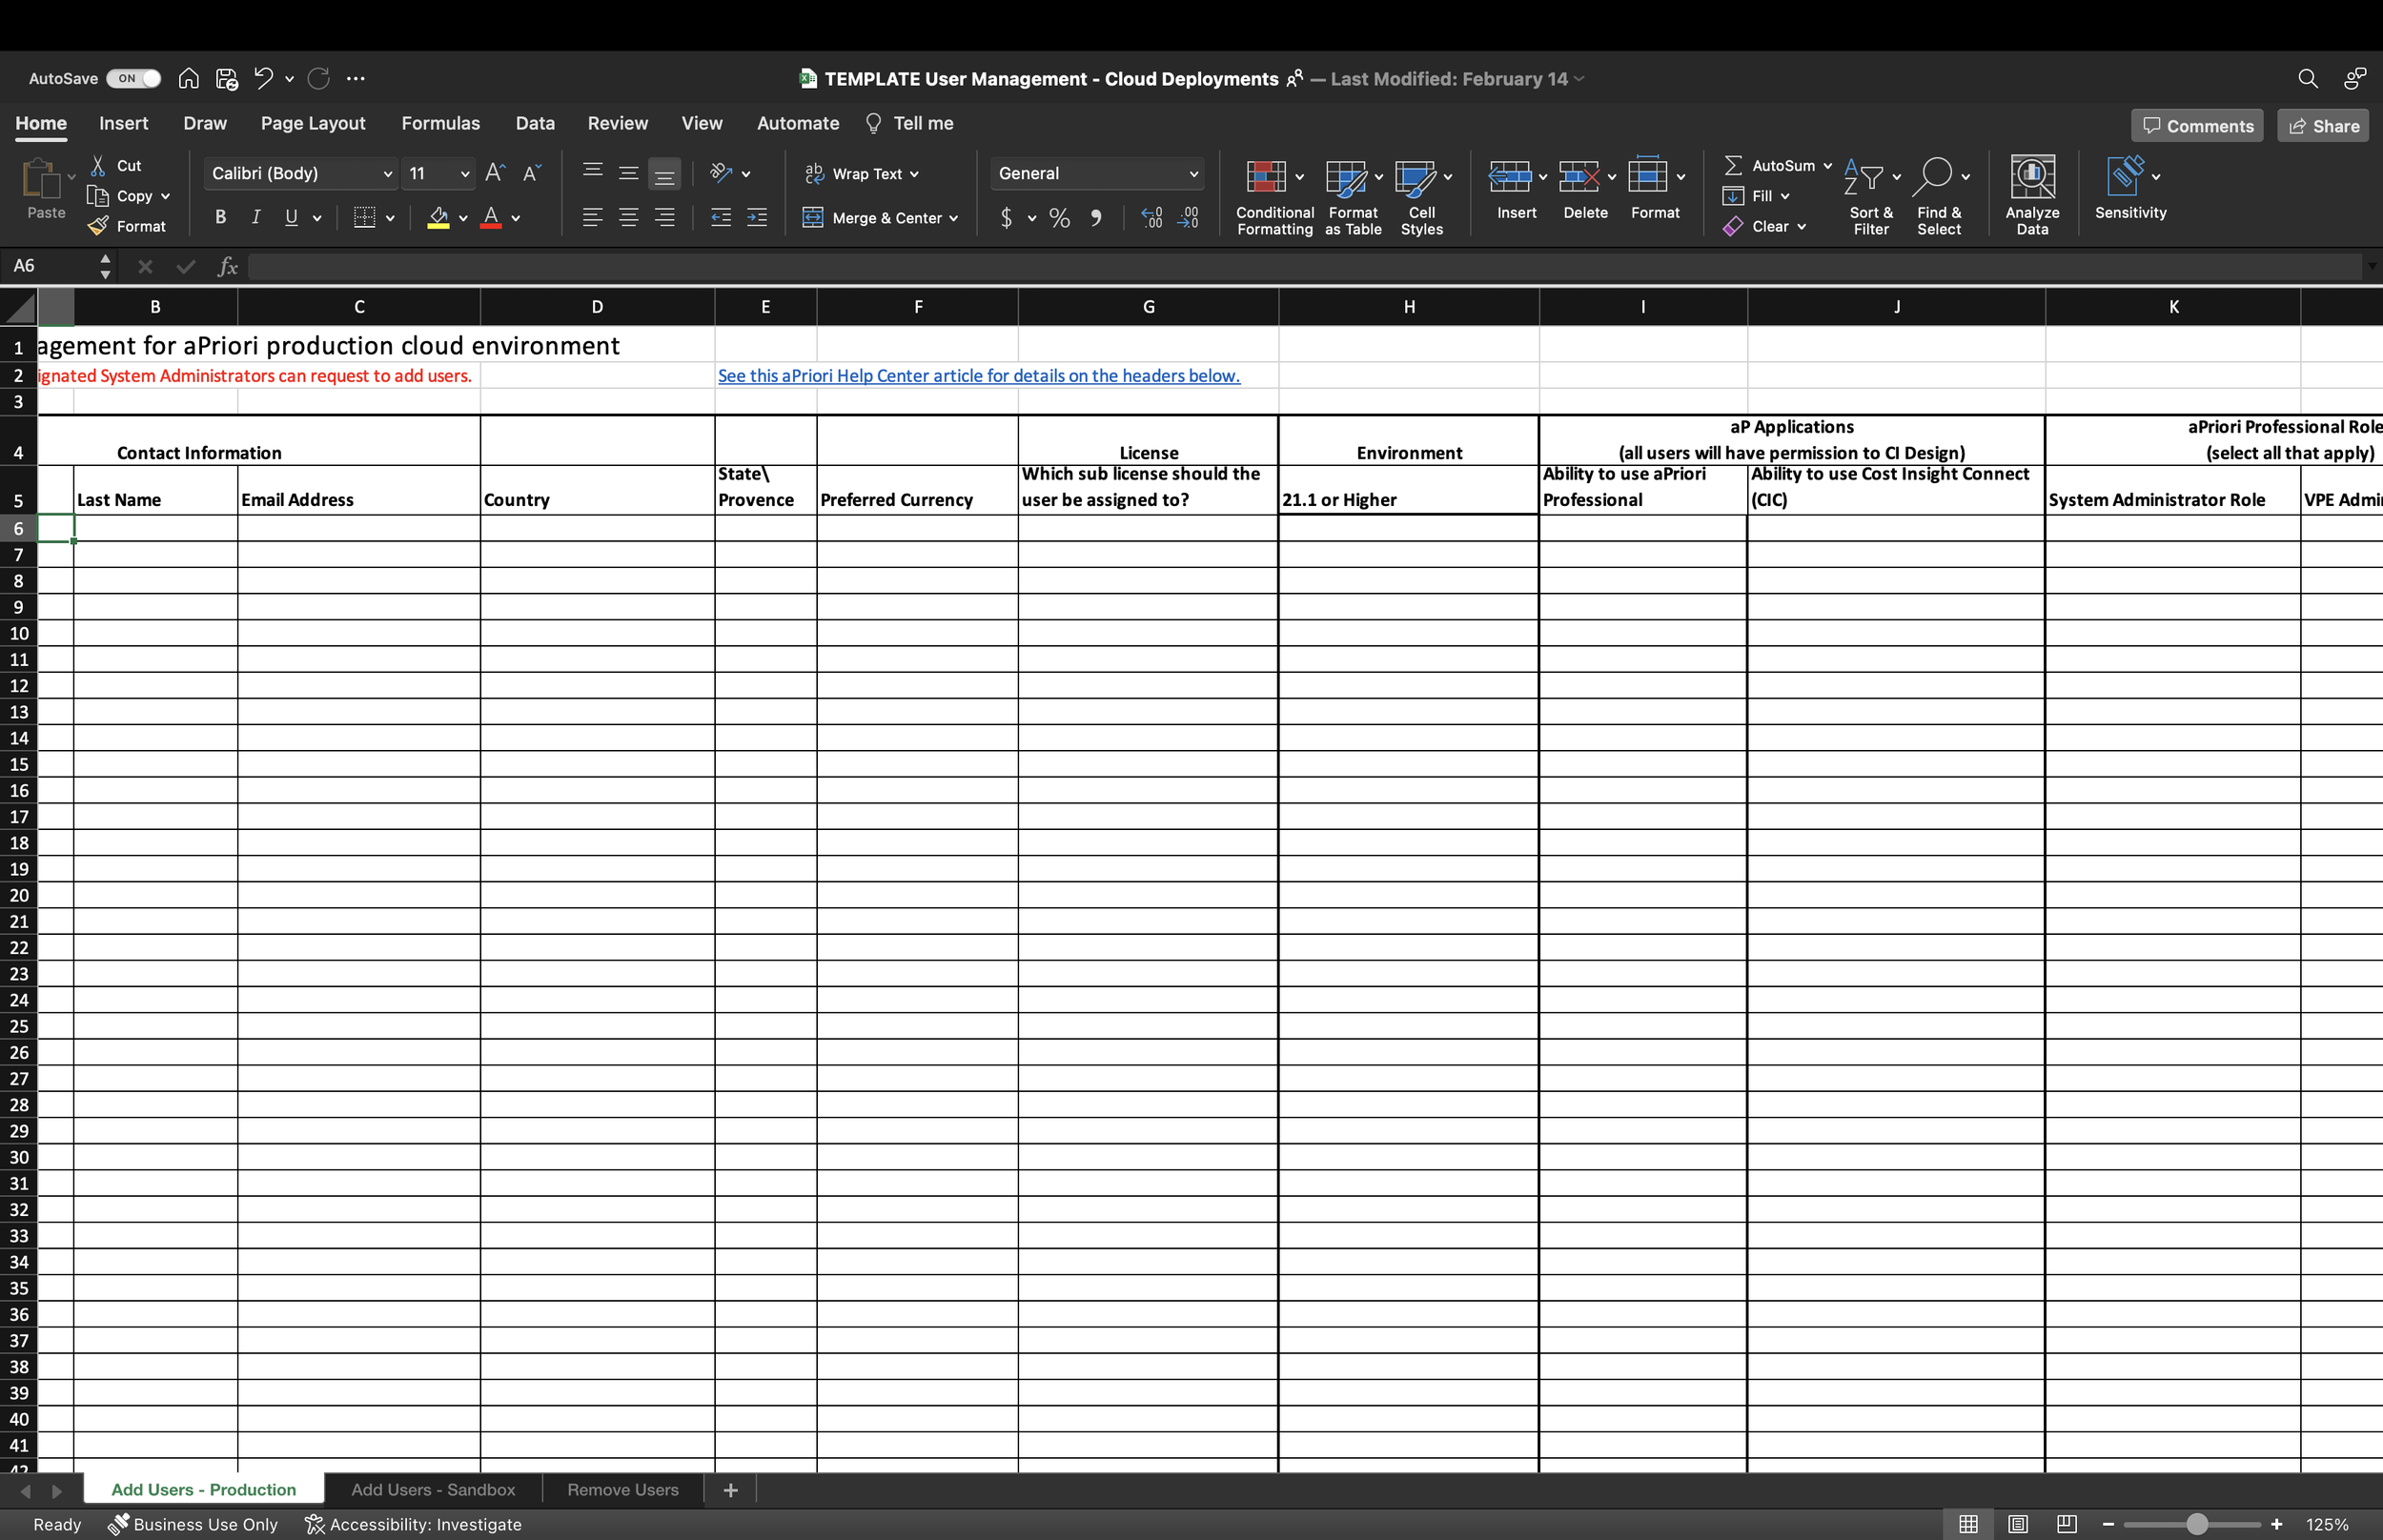
Adding new users or changing the permissions of existing users manually took up to three weeks. In addition, 90% of users had issues logging in for the first time. This painful customer experience resulted in user frustration and raised credibility concerns on the customer end.
User management was done manually using a spreadsheet.
Solution
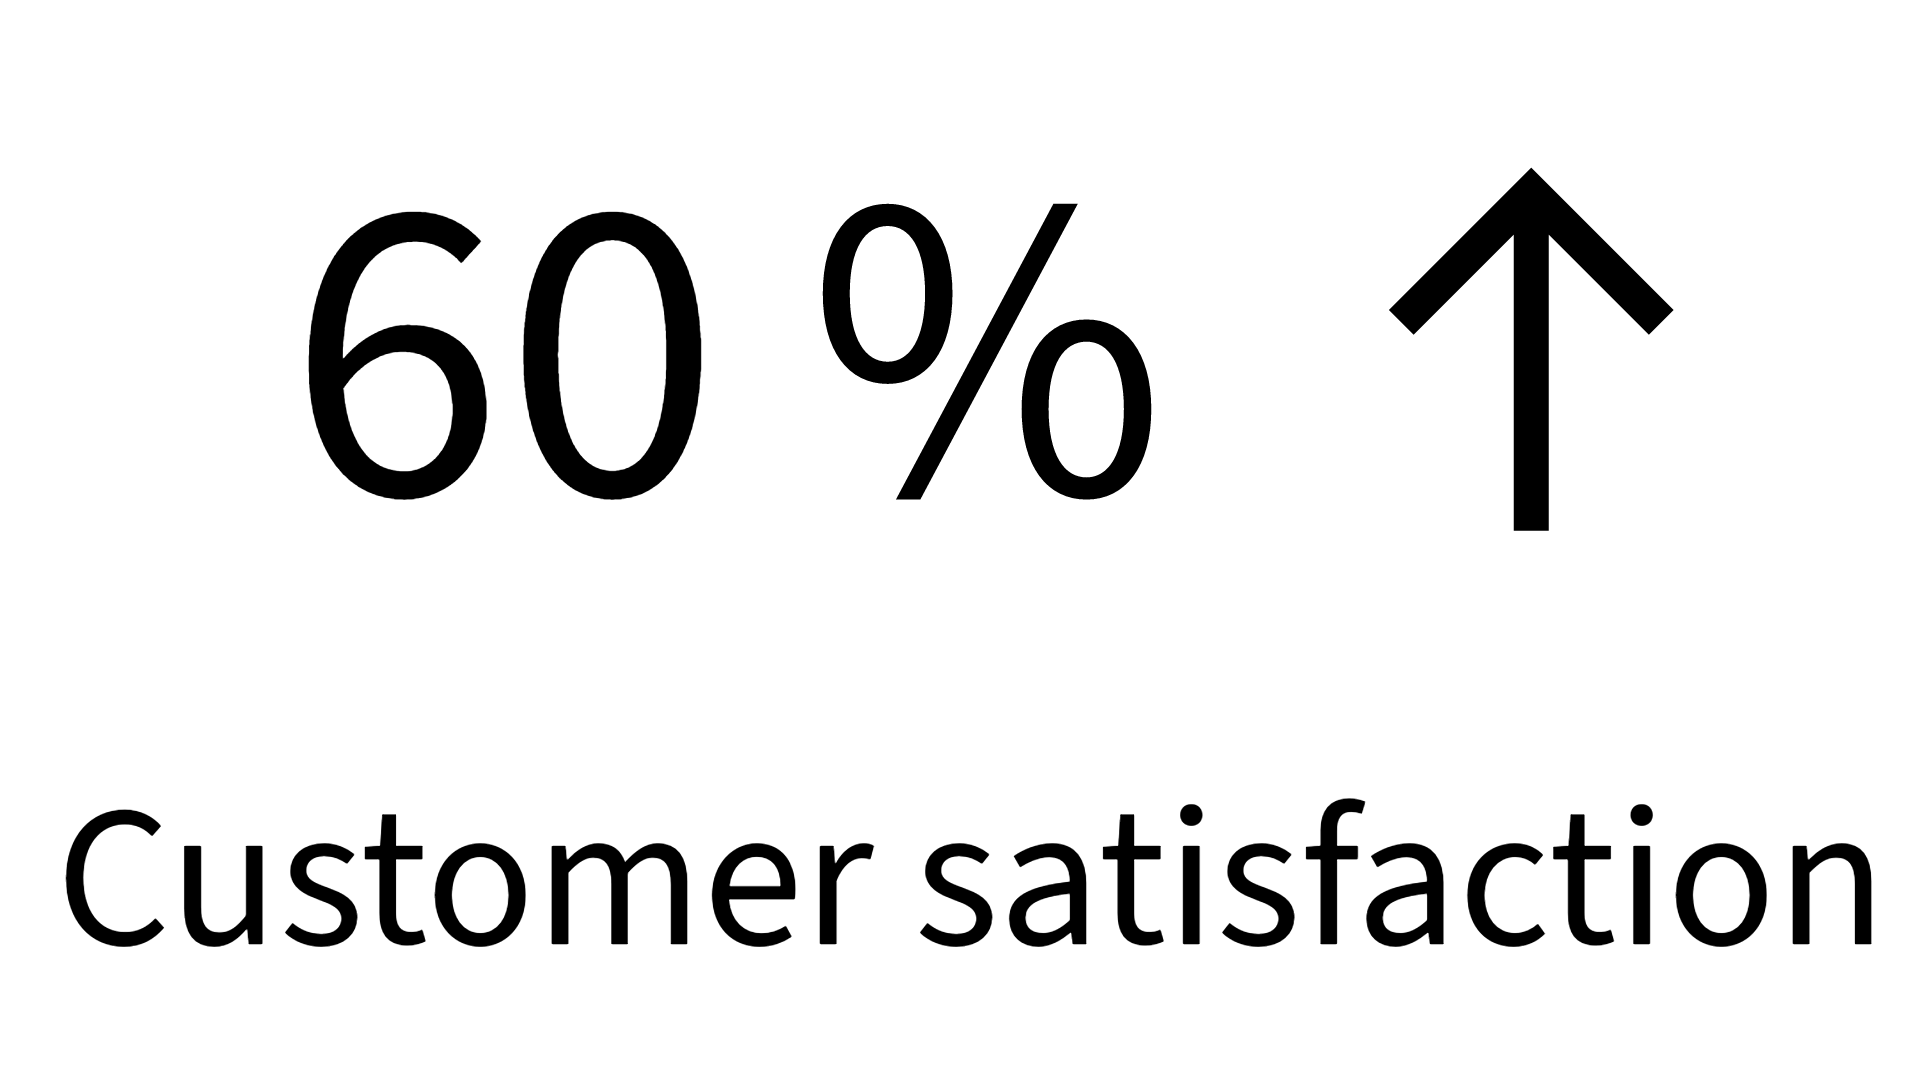
I designed a customer-facing Self-Service Admin application for a smooth, quick, and easy user management experience. The new application allows customer administrators to quickly and efficiently add and remove new users, as well as change permissions and update users' information. The Self-Service Admin increases transparency, efficiency, and user satisfaction.
Impact
Testing with the prototype revealed the following: the Self-Service Admin application solved a major customer pain point-onboarding and user management. It decreased customer support costs, and increased efficiency, and productivity.
Research
Purpose:
I want to better understand how admins currently onboard new users and manage existing users to understand the pain points. I also want to learn what information admins need to manage users to help me create a product that would allow them to complete their tasks.
Method:
15 User Interviews
1:1 semi-structured
Timeline:
2 weeks
Customer Experience Journey Map
Key Findings
90%
Error Rate
10%
Completion Rate
Only 10 % of customers were able to complete the task using an existing manual process.
The manual process resulted in errors and negative customer experience.
The support team was overworked and didn’t have the capacity to address the tickets in a timely manner.
The lack of automation created long delays in onboarding and customer frustration.
6 weeks
Time to value
50 per day
Onboarding tickets
Solution Exploration
Research findings confirmed the hypothesis that automation was the root cause of the problem. Next step was to design an app for customer admin that would allow to add new users and equip admin with the information needed to make decisions regarding users. I decided to focus on three main user views: a dashboard with user analytics, a user management table, and a subscription plan details page. I sketched five different concepts and wireframed the main flows. After validating feasibility with the engineers, I settled on the following layouts.
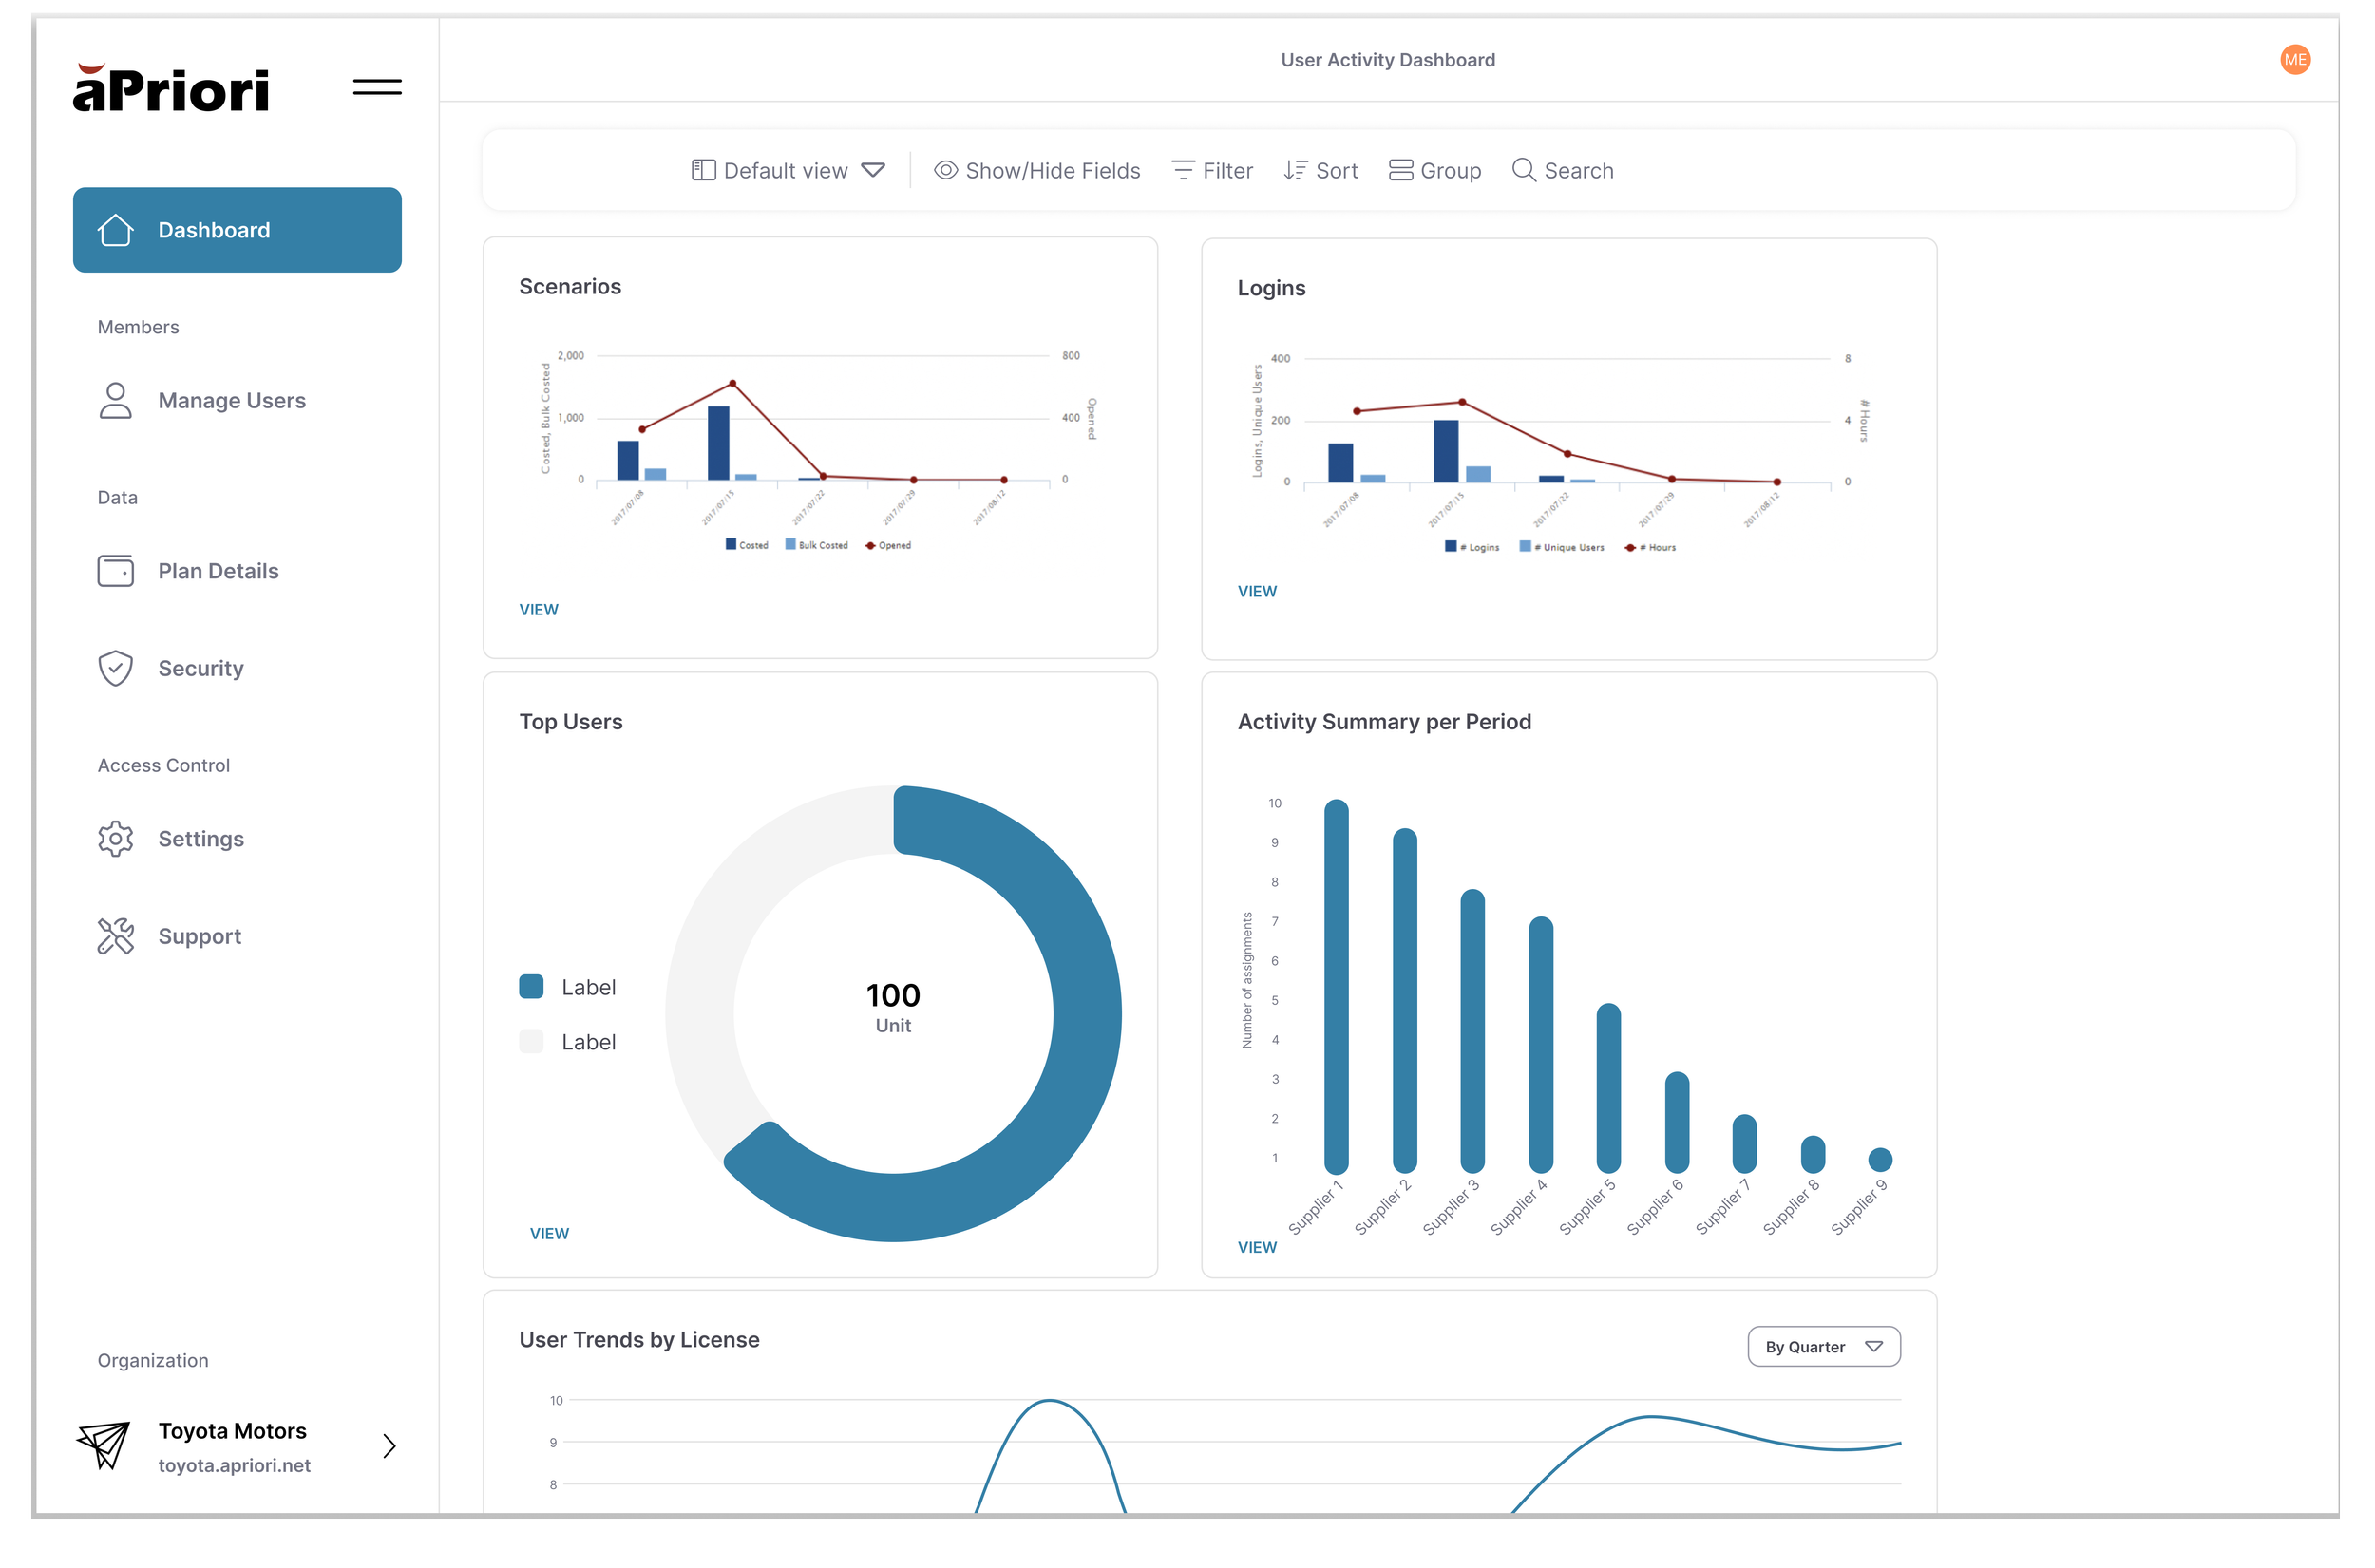
Analytics Dashboard
The dashboard gives admins visibility into user behavior, allowing them to see how licenses are being utilized and if the efficiency can be improved.
The manual process made this information unavailable to the customer, and customer support was required from aPriori.
Providing a dashboard in the application eliminates the need for support and saves money.
User Management Table
The user management table tab allows the customer admin to manage users in the application giving customers control over the users.
New users can be added or removed through the application.
Additionally, permissions and licenses can be reassigned in case of team changes.
Plan Details
The plan details tab gives visibility into contract details.
The licensing of aPriori products is intentionally flexible to accommodate buyers with different needs. However, this interpretation of licensing can get tricky and requires additional support.
Making the licensing terms visible allows the admin to quickly check if there are enough licenses left to add more users and removes the dependency on the support team.
Solution Validation and Findings
First reaction - excitement
Users were very excited about the new application that would give them the ability to independently manage users.
Dashboard need - validated
Users confirmed that the Dashboard with analytics was essential for understanding patterns, events, and active user behavior.
Overall experience - satisfying
Users found a new User Management experience with Role Based Access Control simple and intuitive.
Plan details page need - validated
Users found the Plan Details Page extremely useful for checking license status, and seats, and also for predicting usage and making changes to contracts.
I prototyped the essential screens and flows, such as adding new users, adding in bulk, and managing and removing existing users to test the solution with users. I performed usability studies with customers to verify if the application solved their problem and if I captured all the necessary data for the admin to make and execute decisions when managing users.
Final User Flow
Step 1.
After logging in, a user admin is directed to the Dashboard with User Analytics to track the application usage by individuals and groups.
Step 2.
The user admin selects the Plan Detail tab in the navigation bar to check for available seats and licenses.
Step 3.
The user admin clicks on the Invite Users button to add new users. User admin uploads new user information by either entering user information in the fields or dragging and dropping a CSV file for bulk action.
Step 4.
The user admin clicks on the Manage Users tile in the Navigation bar and edits permissions for a selected user/users.
Next Steps and Metrics to Track
I suggested testing the beta version with some of our customers and iterating the design before shipping the app to all customers. At the same time, I recommended tracking user interactions using Gainsight. and continuing to gather feedback during monthly customer calls. I suggested tracking the following Success Metrics:
-
The research highlighted that adding new users was a major pain point for admin users. The initial testing with the prototype revealed a decrease of 87%, so once the product is launched, I expect the time on tasks to decrease by at least 87%.
-
According to research, the completion rate was as low as 10% and the error rate was 90%. The self-service admin app is expected to increase the task success rate to 90% and reduce errors to 10%.
-
According to research, the completion rate was as low as 10% and the error rate was 90%. The self-service admin app is expected to increase the task success rate to 90% and reduce errors to 10%.
View Other Projects

